The Dashboards
Discovery Event Dashboard
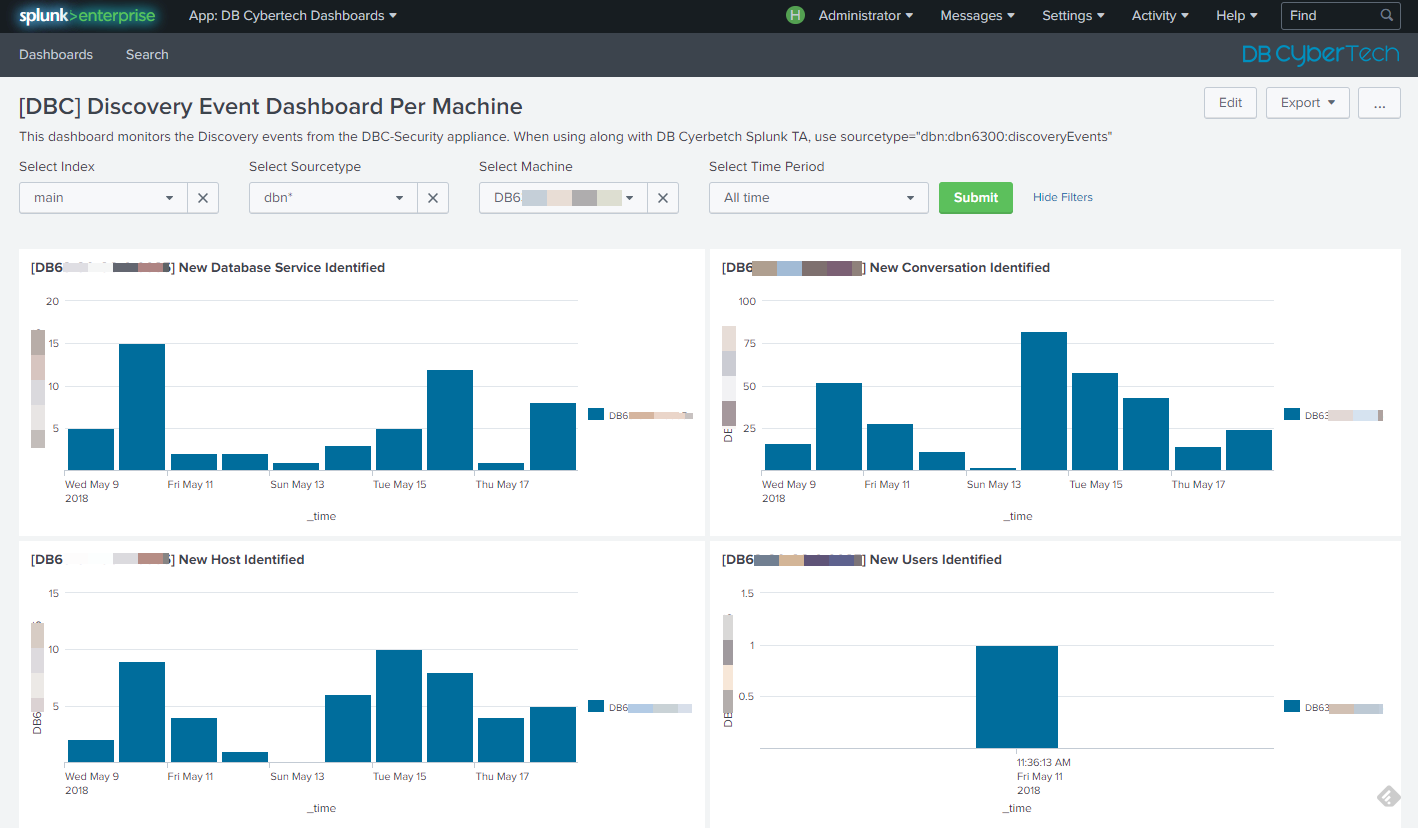
The Discovery Event Dashboard Per Machine monitors the events for new database service, new database conversation, new host identified, and new users identified. Since the syslog events from the DB-Security appliance are sent every 5 to 10 minutes interval, the dashboard panels have a default refresh of 10 minutes.
- New Database Service Identified: This panel specifically monitors the
mds_new_serviceidentifier from the events and tabulates key information useful for the operator. This panel will tell operator if a new database service was created within the network being monitored. - New Conversation Identified: This panel specifically monitors the
tally_new_ipseityidentifier from the events and tabulates key information useful for the operator. This panel will tell operator if a new client is communicating with an existing database service within the network being monitored. - New Host Identified: This panel specifically monitors the
mds_new_hostidentifier from the events and tabulates key information useful for the operator. This panel will tell operator if a new host containing database services is running within the network being monitored. - New Users Identified: This panel specifically monitors the
mds_new_useridentifier from the events and tabulates key information useful for the operator. This panel will tell operator if a new database user was created from within the network being monitored.
- To use this dashboard, you have to provide the following input on the top of the dashboard:
- Select Index: select the proper index where the DB-Security event logs are being collected.
- Select Sourcetype: selecting the proper sourcetype will help in the efficiency fo the dashboard. If you are using the DB Cybertech Add-on for Splunk , then you should use the
dbn:dbn6300:discoveryEventssourcetype. - Select Machine: if your network have multiple DB-Security appliances, then this input will search for the past 7 days for DB-Security machines that have events and list it here in the dropdown. Select the machine that you want to monitor.
- Select Time Period: select the time period that you would like to monitor. For SOC operations, a 3 to 5 days span is more than enough. For investigation purposes, a longer time span may be needed.
Screenshot: Discovery Event Dashboard
Application Security Events
The Application Security Events dashboard monitors the events for databse services that are in “protection mode”. New SQL statements events that contains probable application security (like SQL injection) will appear here, SQL statements events that also contains lexical errors will appear in this dashboard.
This dashboard particularly monitors events that contain distinct_event identifier from the events and tabulates key information useful for the operator. This will tell the operator if a new SQL statement posseses any threat or lexical errors.
- To use this dashboard, you have to provide the following input on the top of the dashboard:
- Select Index: select the proper index where the DB-Security event logs are being collected.
- Select Sourcetype: selecting the proper sourcetype will help in the efficiency fo the dashboard. If you are using the DB Cybertech Add-on for Splunk , then you should use the
dbn:dbn6300:sqliEventssourcetype. - Select Machine: if your network have multiple DB-Security appliances, then this input will search for the past 7 days for DB-Security machines that have events and list it here in the dropdown. Select the machine that you want to monitor.
- Select Time Period: select the time period that you would like to monitor. For SOC operations, a 3 to 5 days span is more than enough. For investigation purposes, a longer time span may be needed.
Screenshot: Application Security Dashboard

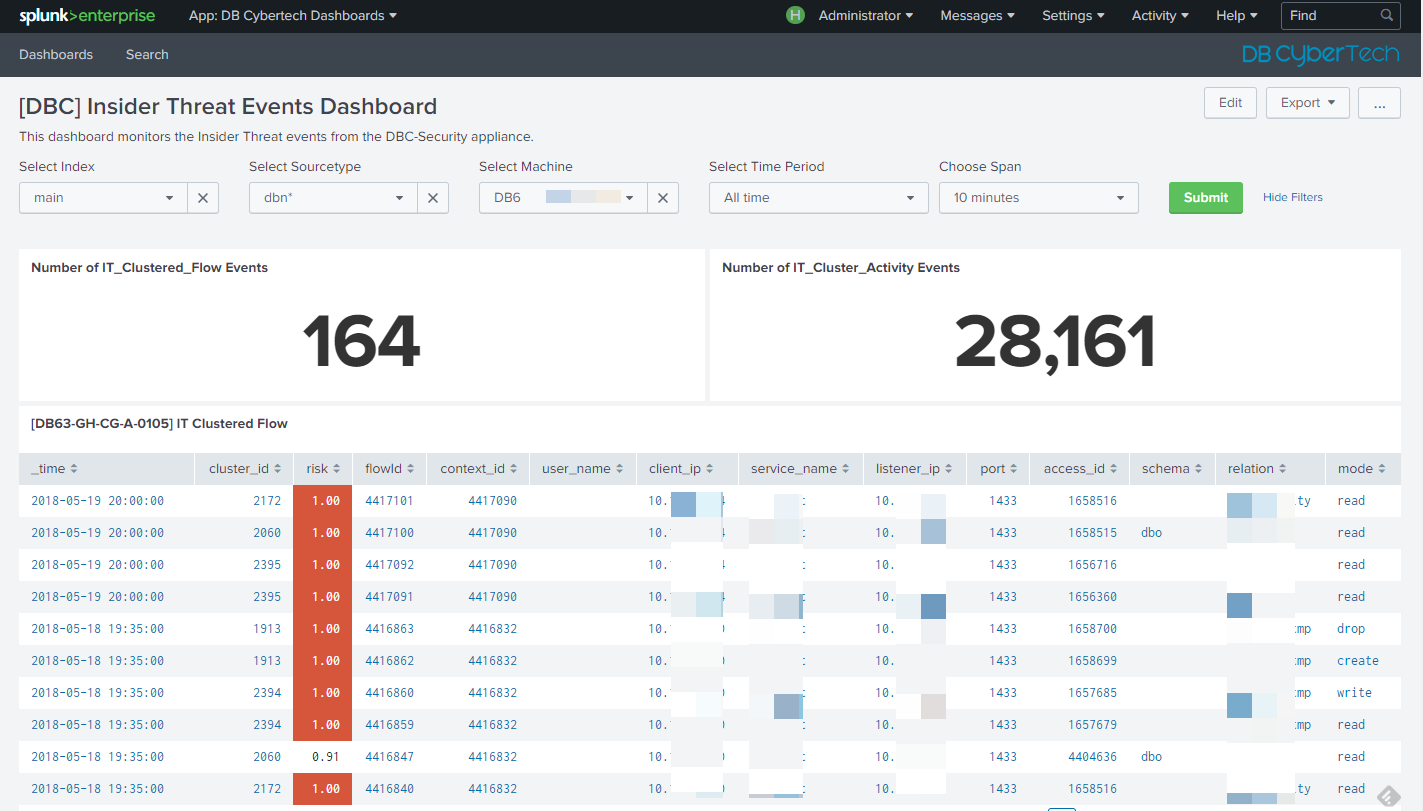
Insider Threat Events
The Insider Threat Events dashboard monitors the events for databse activities that are classified as isnider threat. The insider threat activities are defined in terms of behavioral patterns that are described as data flows. A data flow is a unique pattern of a partially or fully qualified table name accessed in a specific network scenario.
The dashboard particularly monitors the following unique syslog identifiers:
it_clustered_flow: This event is triggered when the autopilot adds a data flow to the incident domain to be clustered with other behavioral incident data flows.it_new_flow: This event is triggered once for each new data flow, the first time it is observed.it_new_cluster: *This event is emitted each time a new incident is created by the system. This happens when new, unexpectd data flows do not sufficiently match an existing incident. *it_cluster_activity: This event is triggered when data flows, previously clustered into an incident exhibit activity.it_policy_activity: This event is emitted when data flows matching a committed policy constraint with a syslog category action exhibit activity.
- To use this dashboard, you have to provide the following input on the top of the dashboard:
- Select Index: select the proper index where the DB-Security event logs are being collected.
- Select Sourcetype: selecting the proper sourcetype will help in the efficiency fo the dashboard. If you are using the DB Cybertech Add-on for Splunk , then you should use the
dbn:dbn6300:insiderThreatEventssourcetype. - Select Machine: if your network have multiple DB-Security appliances, then this input will search for the past 7 days for DB-Security machines that have events and list it here in the dropdown. Select the machine that you want to monitor.
- Select Time Period: select the time period that you would like to monitor. For SOC operations, a 3 to 5 days span is more than enough. For investigation purposes, a longer time span may be needed. When the DB-Security appliance is newly installed and currently in learning period, it may take a couple of weeks before you see an event on this dashboard.
- Choose span: this is used to generate the graphs, the smaller the span, the longer it takes to load the graph.
Screenshot: Insider Threat Event Dashboard
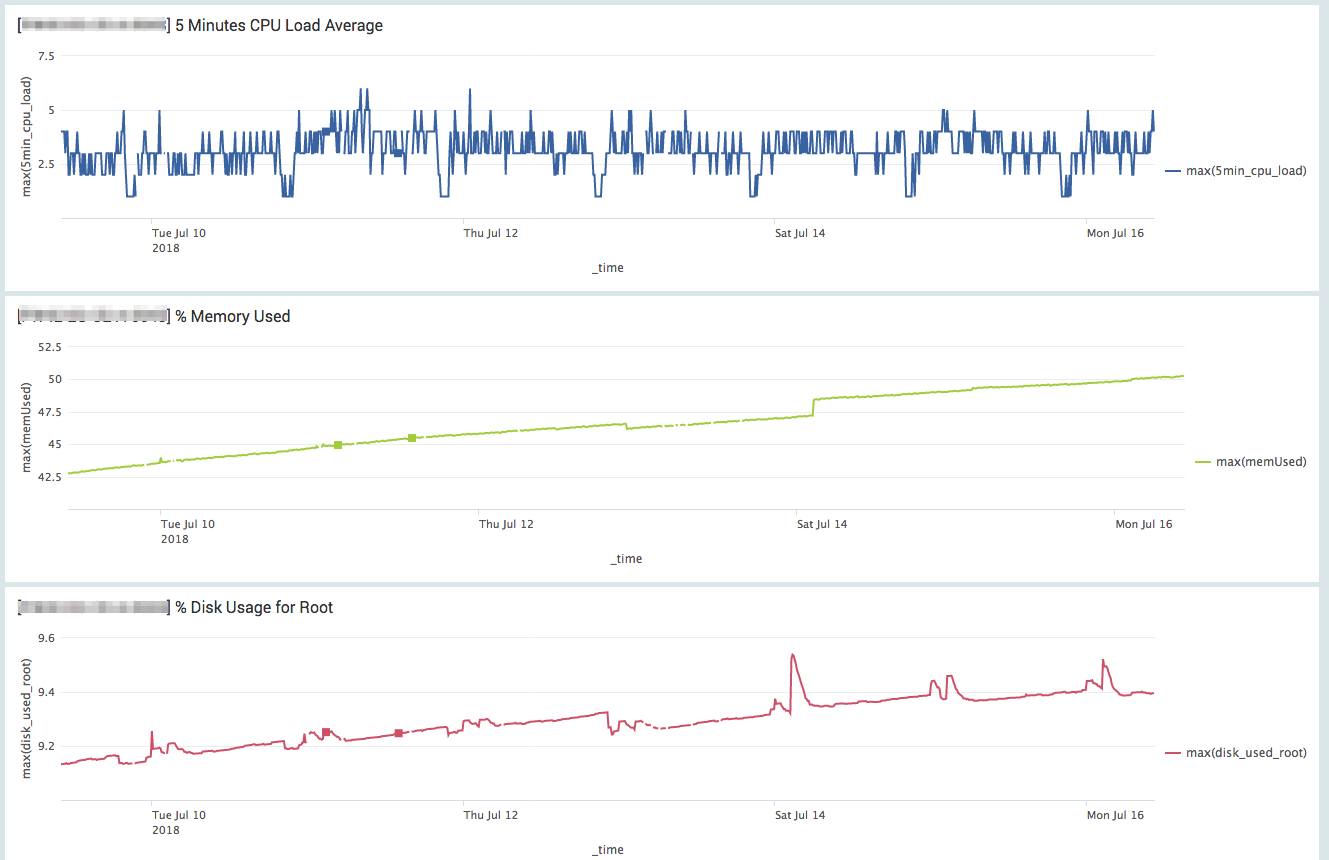
Health Counters
The Health Counters dashboard monitors the basic machine and network traffic health information of the DB-Security appliance.
The dashboard particularly monitors the following unique syslog identifiers and fields:
xcap_X01: Number of packets received by engine on all capture sources. The dashboard graph shows the counter in rate/sec over time.xcap_X13: Number of ethernet packets received by all enabled capture sources. The dashboard graph shows the counter in rate/sec over time.xcap_X12: Packets dropped in the engine due to flow control or memory management pressure. The dashboard graph shows the counter in rate/sec over time.xcap_X33: Packets received by kernel. The dashboard graph shows the counter in rate/sec over time.xeng_X30: Number of feed complete events (DB operation executions). The dashboard graph shows the counter in rate/sec over time.os_loadavg_1: 5 minute CPU load average over timetotalmem , freemem: presented in the graph as the percentage memory used by the systemdisk_root_total , disk_root_avail: presented in the graph as the percentage of root disk usagedisk_b_total , disk_b_avail: presented in the graph as the percentage of the disk usage in b partitionengine_start: monitors an event wherein the dbfw engine process was retstarted. Note: this does not necessarily indicate that the enitre machine was rebooted.
- To use this dashboard, you have to provide the following input on the top of the dashboard:
- Select Index: select the proper index where the DB-Security event logs are being collected.
- Select Sourcetype: selecting the proper sourcetype will help in the efficiency fo the dashboard. If you are using the DB Cybertech Add-on for Splunk , then you should use the
dbn*sourcetype. - Select Machine: if your network have multiple DB-Security appliances, then this input will search for the past 7 days for DB-Security machines that have events and list it here in the dropdown. Select the machine that you want to monitor.
- Select Time Period: select the time period that you would like to monitor. For SOC operations, a 3 to 5 days span is more than enough. For investigation purposes, a longer time span may be needed.
- Choose span: this is used to generate the graphs, the smaller the span, the longer it takes to load the graph. If you would like to view 1 month or greater time period, choose a span of 1 hour or greater to load the graphs faster.
Screenshot: Health Counters Dashboard

Screenshot: System Health
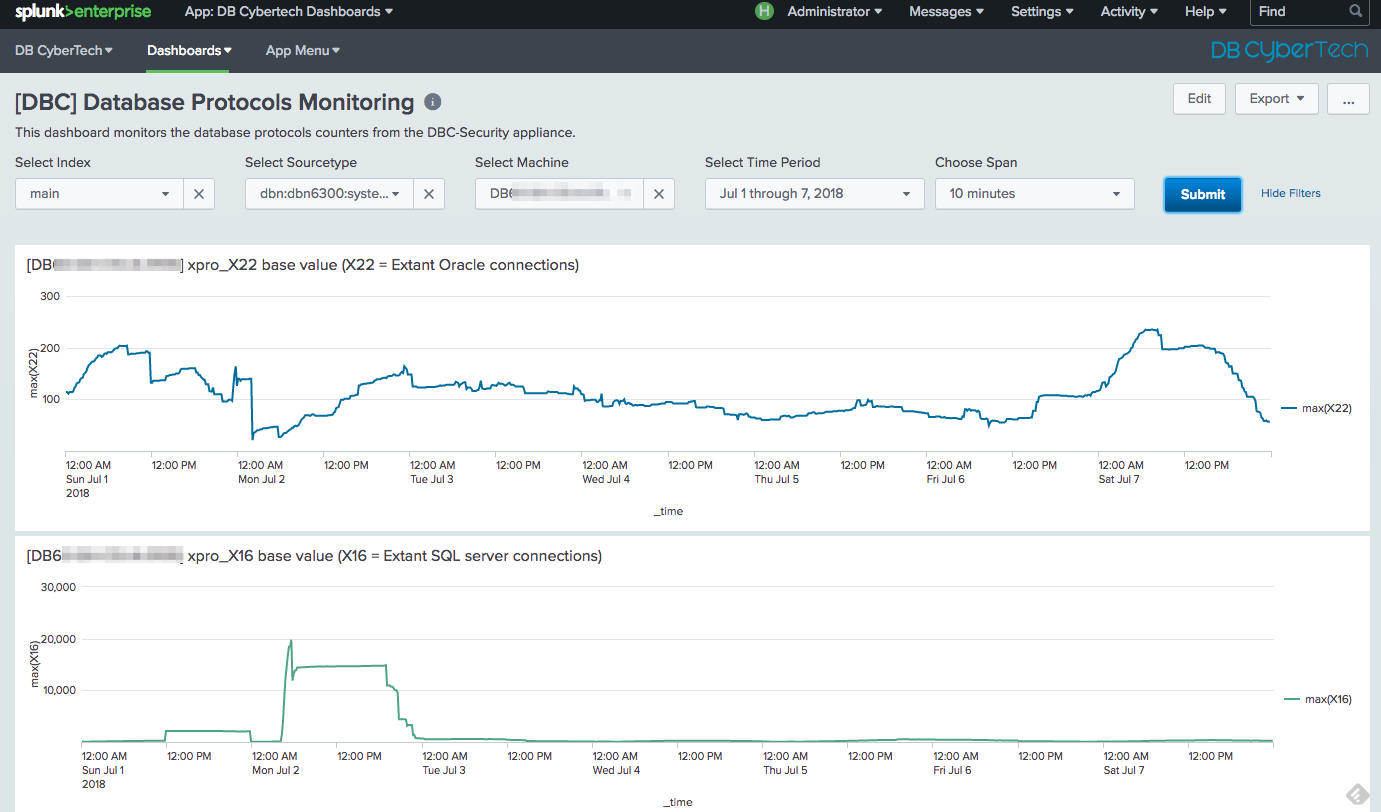
Database Protocols Monitoring
The Database Protocols Monitoring dashboard monitors database protocols that are detected within the network that is being monitored by the DB-Security appliance. The dashboard particularly monitors the following unique syslog identifiers and fields:
xpro_X22: Extant Oracle connections. The dashboard graph shows the counter base value over time.xpro_X16: Extant SQL server connections. The dashboard graph shows the counter base value over time.xpro_X06: Extant Sybase connections. The dashboard graph shows the counter base value over time.xpro_X34: Number of extant unidirectional connections. The dashboard graph shows the counter base value over time.xpro_X08: Extant Connections. The dashboard graph shows the counter base value over time.xpro_X18: SQL Server records seen (requests and responses). The dashboard graph shows the counter in rate/sec over time.xpro_X25: Oracle request messages. The dashboard graph shows the counter in rate/sec over time.xcap_X04: Fraction of packets received and processed post BPF Filter. The dashboard graph shows the percentage over time.xpro_X23: Ratio of Oracle requests decoded vs all Oracle request. The dashboard graph shows the percentage over time.xpro_X24: Ratio of Oracle requests decoded vs all Oracle request where no gap present. The dashboard graph shows the percentage over time.xpro_X19: Ratio of good SQL server record decodes vs all protocols records handled. The dashboard graph shows the percentage over time.xpro_X05: Ratio of good Sybase protocol record decodes vs all protocols records handled. The dashboard graph shows the percentage over time.xpro_X41: DB2 parses without dialect being set. The dashboard graph shows the counter in rate/sec over time.xpro_X46: DB2 queries opened (executed). The dashboard graph shows the counter base value over time.
- To use this dashboard, you have to provide the following input on the top of the dashboard:
- Select Index: select the proper index where the DB-Security event logs are being collected.
- Select Sourcetype: selecting the proper sourcetype will help in the efficiency fo the dashboard.
- Select Machine: if your network have multiple DB-Security appliances, then this input will search for the past 7 days for DB-Security machines that have events and list it here in the dropdown. Select the machine that you want to monitor.
- Select Time Period: select the time period that you would like to monitor. For SOC operations, a 3 to 5 days span is more than enough. For investigation purposes, a longer time span may be needed.
- Choose span: this is used to generate the graphs, the smaller the span, the longer it takes to load the graph. If you would like to view 1 month or greater time period, choose a span of 1 hour or greater to load the graphs faster.
Screenshot: Database Protocols Monitoring